We will now discuss the various types of graphs which can be used to calculate ‘speed’ (or velocity), ‘acceleration’ and ‘distance travelled’ by a body. A very important point to remember here is that in the drawing of graphs, the terms ‘speed’ and ‘velocity’ are used in the same sense. In most of the graphs which we are going to discuss now, we will be using the term ‘speed’. At some of the places, however, the term ‘velocity’ will also be used. This is because even in the examination papers, they use both the terms ‘speed’ as well as ‘velocity’ in the questions based on graphs. We will first study the ‘distance-time graphs’ and then ‘speed-time graphs’ (or velocity-time graphs). Please note that in drawing graphs based on motion, ‘time’ is always taken along the x-axis whereas ‘distance’ or ‘speed’ (or velocity) is taken along the y-axis.
1. DISTANCE – TIME GRAPHS
When a body moves with uniform speed, it will travel equal distances in equal intervals of time. In other words, the distance travelled is directly proportional to time. Thus, for uniform speed, a graph of distance travelled against time will be a straight line as shown by line OA in Figure 32. Please note that we can also write the term “uniform velocity” in place of “uniform speed” in the graph . We can now say that the distance-time graph of a body moving at uniform speed is always a straight line. In other words, a straight line graph between distance and time tells us that the body is moving with a uniform speed.

The slope of a distance-time graph indicates speed of the body. So, the distance-time graph of a body can be used to calculate the speed of the body. To find the speed from the distance-time graph of a body, we take any point A on the straight line graph (Figure 33), and drop a perpendicular AB on the time axis (x- axis). It is clear that AB represents the distance travelled by the body in the time interval represented by OB (Figure 33). We know that:
Speed = Distance travelled / Time taken
Now, in Figure 33, the distance travelled is OC which is in fact equal to AB, and the time taken is OB. So, putting distance = AB and time = OB in the above relation, we get :
speed = AB /OB
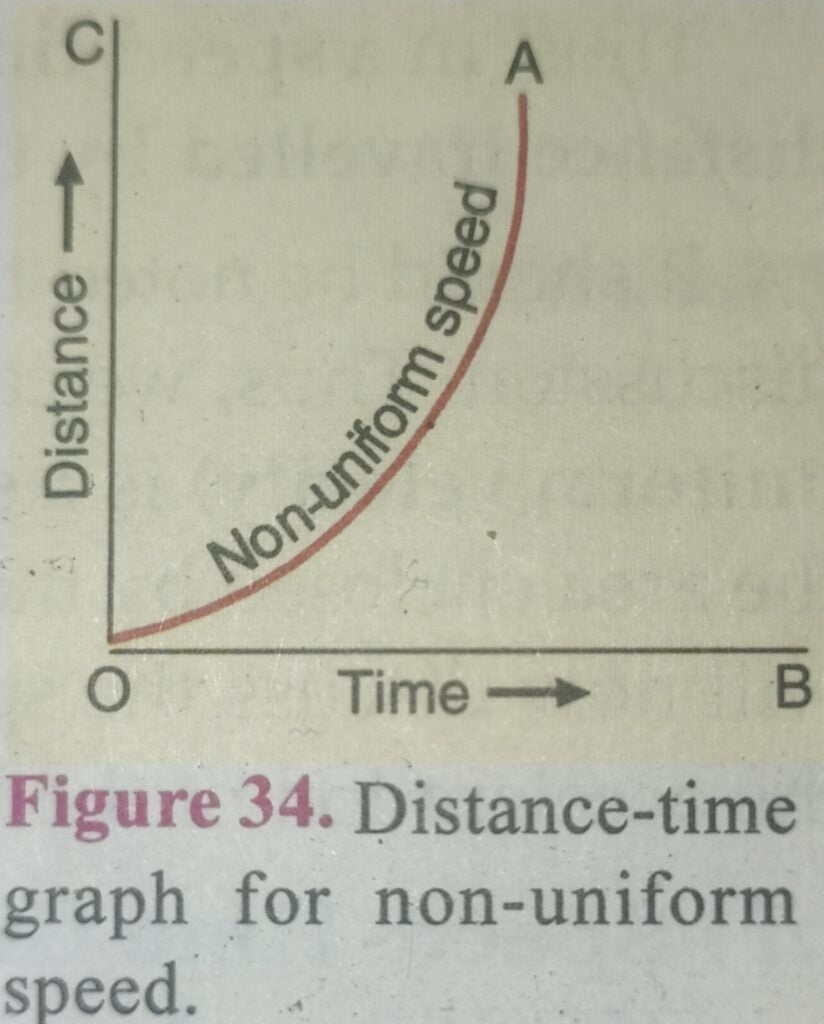
But AB / OB is known as the slope (or gradient) of the graph line OA, therefore, in a distance-time grapn for uniform speed, the speed of the body is given by the slope of the graph. In other words, the slope of a distance-time graph indicates speed. Thus, we can use a distance-time graph of a body to find the value of speed of the body. All that we have to do is to find out the slope of distance-time graph as shown above and that gives the speed of the body. We have seen above that if the speed of a body is uniform then its distance- time graph is a straight line (as shown in Figure 32). If, however, the speed of a body is non-uniform, then the graph between distance travelled and time is curved line (called a parabola) as shown in Figure 34. a We get the following conclusions from the above discussion :
(i) If the distance-time graph of a body is a straight line, then its speed is uniform.
(ii) Ifthe distance-time graph of a body is a curved line, then its speed is non-uniform.
We know that when a body moves with a non-uniform speed, then its motion is said to be accelerated. So, the curved line OA in Figure 34 also represents the distance-time graph of a body moving with accelerated motion. If a displacement-time graph is drawn, then it will specifically represent “velocity’. For example,
if the displacement-time graph of a moving body is a straight line, then it represents uniform velocity of the body. We will now discuss the speed-time graphs of a moving body. In fact, the speed-time graphs are also known as velocity-time graphs. So, whether we write a speed-time graph or a velocity-time graph, it will mean the same thing.

2 SPEED – TIME GRAPHS ( OR VELOCITY – TIME GRAPHS )
We can have three types of speed-time graphs for a moving body. These three cases are:
(i) When the speed of the body remains constant (and there is no acceleration)
(ii) When the speed of the body changes at a uniform rate (there is uniform acceleration)
(iii) When the speed of the body changes in a non-uniform way (there is non-uniform acceleration)
We will now discuss these three types of speed-time graphs in detail, one by one.
(i) Speed-Time Graph when the Speed Remains Constant.
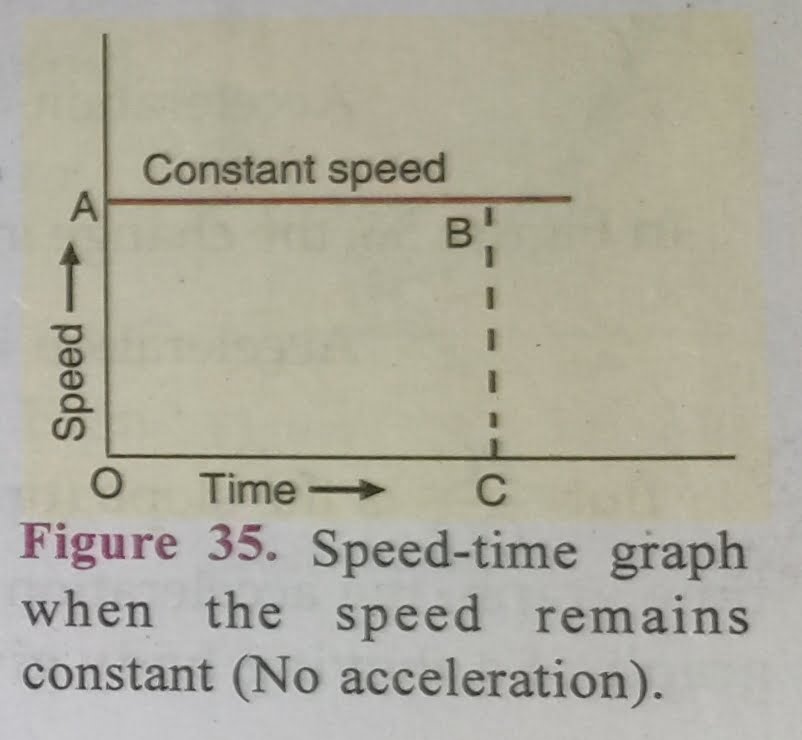
By saying that the speed of a body is constant (or uniform), we mean that the speed does not change with time and hence there is no acceleration. So, a speed-time graph for a body moving with constant speed (or uniform speed) is a straight line parallel to the time axis (as shown by the line AB in Figure 35).

In other words, if the speed-time graph of a body is a straight line parallel to the time axis, then the speed of the body is constant (or uniform). Since the speed of the body is constant or uniform, there is no acceleration, and hence there is no question of finding the acceleration from such a speed-time graph. We can, however, find the distance travelled by the body in a given time from such a speed-time graph. This is described below.
We know that, speed = distance travelled/time taken
. So, Distance travelled = speed × time taken —-(1)
Now, to find out the distance travelled by the body at point C (Figure 35), we draw a perpendicular CB at point C which meets the straight-line graph at point B.
Now, speed at C = CB.
But C = OA.
Thus, Speed at. C = OA. —-(2)
And, Time at C = OC —-(3)
Now, putting these values of speed and time in relation ( 1 ), we get :
Distance travelled = OA × OC. ( See figure 35 )
Distance travelled = Area of rectangle OABC
Thus, in a speed-time graph, the area enclosed by the speed-time curve and the time axis gives us the distance travelled by the body.
It should be noted that we can also use the term “velocity” in place of “speed” everywhere in the above discussion. Thus, we can say that the velocity-time graph of an object moving with constant velocity tor uniform velocity) is a straight line parallel to the time axis. We can also say that in a velocity-time graph, the area enclosed by the velocity-time curve and the time axis gives the distance travelled by the object. We will now discuss the speed-time graph of a body when its speed changes at a uniform rate, that is, when the acceleration of the body is uniform.
(ii) Speed-Time Graph when Speed Changes at a Uniform Rate (Uniform Acceleration).
When a body moves with uniform acceleration, its speed changes by equal amounts in equal intervals of time. In other words, the speed becomes directly proportional to time. Thus, the speed-time graph for a uniformly changing speed (or uniform acceleration) will be a straight line (as shown by line OP in Figure 36).
We can find out the value of acceleration from the speed-time graph of a moving body. Now, to calculate the acceleration at a time corresponding to point Q (Figure 36), we draw a perpendicular QP from point Q which touches the straight line graph at point P. We know that :
change in speed ( or velocity )
ACCELERATION = —————————
. Time taken
In Figure 36, the change in speed is represented by PQ whereas time taken is equal to OQ. So, . Acceleration = PQ / OQ
But PQ / OQ is the slope (or gradient) of the speed-time graph OP, therefore, we conclude that in a speed- But OQ time graph, the acceleration is given by the slope of the graph. In other words, the slope of a speed-time graph of a moving body gives its acceleration. The distance travelled by a moving body in a given time can also be calculated from its speed- time graph. As explained earlier, the distance travelled by the body in the time corresponding to point Q (Figure 36 ) will be equal to the area of the triangle OPQ which is equal to half the area of the rectangle ORPQ. Thus, Distance travelled = Area of triangle OPQ


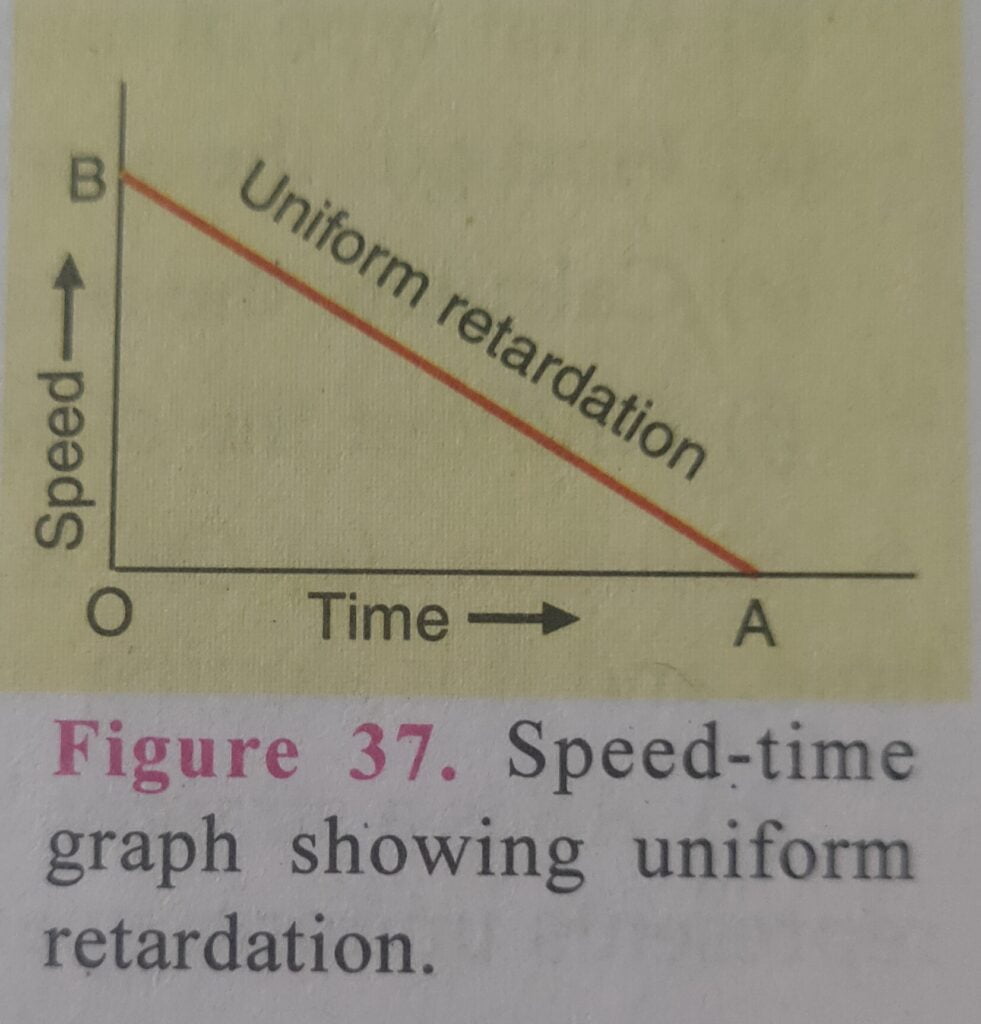
Please note that in a speed-time graph of a body, a straight line sloping upwards (as in Figure 36) shows uniform acceleration. On the other hand, in a speed-time graph of a body, a straight line sloping downwards (as in Figure 37) indicates uniform retardation.
It should be noted that we can also use the word “velocity” in place of “speed” everywhere in the above discussion. Thus, we can also say that the velocity-time graph of a body moving with uniform acceleration is a straight line. And that the slope of velocity-time graph of a body indicates its acceleration.
In the speed-time graph shown in Figure 36, we have assumed that the initial speed of the body is zero. It is, however, possible that the body has some initial speed and then it starts accelerating at a uniform rate. So, we will now discuss the speed-time graph of a body whose initial speed is not zero.
Speed-Time Graph when the Initial Speed of the Body is Not Zero
Figure 38 shows the speed-time graph of a body having an initial speed equal to OB and then accelerating from B to C. In order to calculate the value of acceleration from such a graph, we will have to subtract the initial speed (OB) from the final speed (AC), and then divide it by time (OA).
In such cases also, the distance travelled by the body in a given time is equal to the area between the speed-time graph and the time axis. For example, in this case the distance travelled by the body in time OA (Figure 38), will be equal to the area of the figure OBCA under the speed-time graph BC. Now, the figure OBCA has two parallel sides OB and AC and such a figure is known as a trapezium. Thus, the distance travelled by the body in this case is equal to the area of trapezium OBCA. Now,


We will now discuss the speed-time graph of a body whose speed does not change at a uniform rate, that is, when the acceleration of the body is non-uniform.
(iii) Speed-Time Graph when Speed Changes at a Non-Uniform Rate (Non-Uniform Acceleration)
When the speed of a body changes in an irregular manner, then the speed-time graph of the body is a curved line (as shown by the line OA in Figure 39). Even now, the distance travelled by the body is given by the area between the speed- time curve and the time axis.Once again, please note that we can write the word “velocity” in place of “speed” in the above graph So, we can also say that the velocity-time graph for non-uniform acceleration is a curved line called parabola We will now solve some problems based on graphs.


